 |
| Me with the CTD. |
Log #11
Oceanography
September 25, 2010
Teacher at Sea: Donna Knutson
Ship Name: Oscar Elton Sette
Mission and Geographical Area:
The Oscar Elton Sette is on a mission called HICEAS, which stands for Hawaiian Islands Cetacean and Ecosystem Assessment Survey. This cruise will try to locate all marine mammals in the Exclusive Economic Zone called the "EEZ" of Hawaiian waters. The expedition will cover the waters out to 200 nautical miles of the Hawaiian Islands.
Data such as conductivity, temperature, depth, and chlorophyll abundance will be collected and sea bird sightings will also be documented.
 |
| Getting the CTD ready for the water. |
Science and Technology:
Latitude: 24○ 28.8’ N
Longitude: 165○ 50.5’ W
Clouds: 3/8 Cu,Ac
Visibility: 10 N.M.
Wind: 12 Knots
Wave height: 1-2ft.
Water Temperature: 26.6○ C
Air Temperature: 25.2○ C
Sea Level Pressure: 1021.1 mb
Oceans cover 71% of the Earth. They contain 97% of the water on the planet, and amazingly 95% of the world under the ocean is unexplored!
 |
| Ray uses the crane to lift the CTD into the water. |
Oceanography or marine science is a branch of earth science that covers many topics. The studies can include marine organisms, ecosystems, ocean currents, waves, plate tectonics, and changes in the chemistry or physical properties within the ocean. Physical properties are properties which can be measured from the water such as temperature, salinity, mixing of waves, tides and acoustics.
There are many reasons to study the ocean, but one reason is to understand global changes. The atmosphere and oceans are linked through processes of evaporation and precipitation. Weather worldwide is determined by the oceans physical and chemical properties, and its influence on air currents.
The National Oceanic and Atmospheric Administration (NOAA) collects data from oceans throughout the world, evaluates it, then distributes weather forecasts to various weather reporting agencies. NOAA has the largest archives of oceanographic data in the world, and is using the information in long term monitoring of ocean climates and ocean research.
 |
| Corey is processing her chlorophyll. |
The Oscar Elton Sette is obtaining such data. The bridge of the Sette is transmitting data (as seen at the top of this blog) such as latitude, longitude, temperatures, pressure etc. to NOAA recording sites in order to plan weather forecasts. The scientists are also acquiring data, but this data is more specific to the ocean water’s chemistry. They are measuring temperature, conductivity, salinity, and chlorophyll abundance.
Temperature and salinity differences within the ocean lead to increased circulation. Water has a similar circulation pattern to air. They are both fluids and behave accordingly. When heated, fluids will absorb the heat causing the molecules to move faster. Now that the molecules are colliding more often, they become farther apart. The spread out molecules, in air or water, do not have the same density as before. Because they are less dense, they are pushed up and away from the more dense portion of the fluid.
 |
| Corey is dropping in the XBT to measure temperature. |
Due to the differences in density, either caused by changes in temperature or salinity, a small current will form. This circulation causes a turn-over effect, and increases the amount of nutrients in the water. These nutrients will feed the phytoplankton (measured as chlorophyll) and microbes. These “animals” are on the bottom of the food chain, will become food for larger animals and so on. Changes in density and salinity are only a small but important means to move nutrients within the water column.
Most of the mixing of water is due to large currents. The Hawaiian Archipelago, because of its location, does not have a lot of mixing water. It is in the middle of the North Pacific Gyre. A gyre is a large system of rotating currents. The North Pacific Gyre is a system of four ocean currents converging in the same area causing a circular motion. At the “edges” of the gyre, a lot of mixing is taking place due to the motion of the incoming currents, while at the center of the gyre, there is the least amount of movement and therefore the least mixing up of nutrients.
The North Pacific Gyre is located between the equator and 50○ latitude. It makes up the largest ecosystem on Earth measuring twenty million square kilometers. If the nutrients are more plentiful at the edges of the gyre, then the ecosystem has an uneven distribution of animal life.
 |
| These are used for the bucket sample. |
Personal Log:
I have been assisting Corey, the oceanographer on the Sette. My “job” is not in analyzing her data, but rather to help make sure the main instrument that is used to take data is not at risk of hitting the boat when it is in the water. It sounds as though I’m in charge of security. Yeah that’s right I am part of the CDT security team!
The CTD (conductivity, depth, temperature) device consists of twelve bottles attached to a large rack. The entire mechanism weighs several hundred pounds, and is lowered into the water by a crane. When in the water, it is important that the device goes all the way down to one thousand meters without being pulled side to side or under the ship where the cable may become wrapped around a propeller. That would be tragic! So in the scheme of things, my meager “security” position is very important. The CTD is lowered into the ocean one hour before sunrise and one hour after sunset. (I only do the morning “security”).
Because this is a very sophisticated piece of electronic equipment, there is also a person in charge of maintaining the CTD to make sure the instrument is working correctly. This position is called a survey tech. Scott is the survey tech who supports Corey. As the CTD is lowered into the water, Scott checks to make sure everything is working properly, and once it reaches one thousand meters, he starts taking readings.
 |
| Scott is the "survey tech" that works of the CTD. |
Scott takes a reading every one hundred meters until it reaches the surface once again. From his work station, the data of conductivity (which is a measurement caused by salinity), depth, temperature, and oxygen is plotted on a graph. From the data collected, Corey organizes it and reports it along with latitude and longitude.
The bottles on the CTD “fire” or rather trap water at various depths. When brought back to the surface Corey tests the water for chlorophyll which is her nutrient indicator. The more nutrients suggest that the water is more productive and can maintain larger animal populations.
Corey has other tests to check chlorophyll and temperature just to make sure the instrumentation on the CTD is working properly. Three times a day along the route, (the boat stays in one place for the CTD), she does another temperature test down to 760 m, it is called the XBT (expendable bathometric temperature). The XBT is a small black sensor which is weighted and connected by a copper wire to the ships computer back in the lab. As the XBT is dropped behind the ship it records temperature data all the way down. The ship’s computer graphs the temperature changes from 0 – 760m for two minutes.
 |
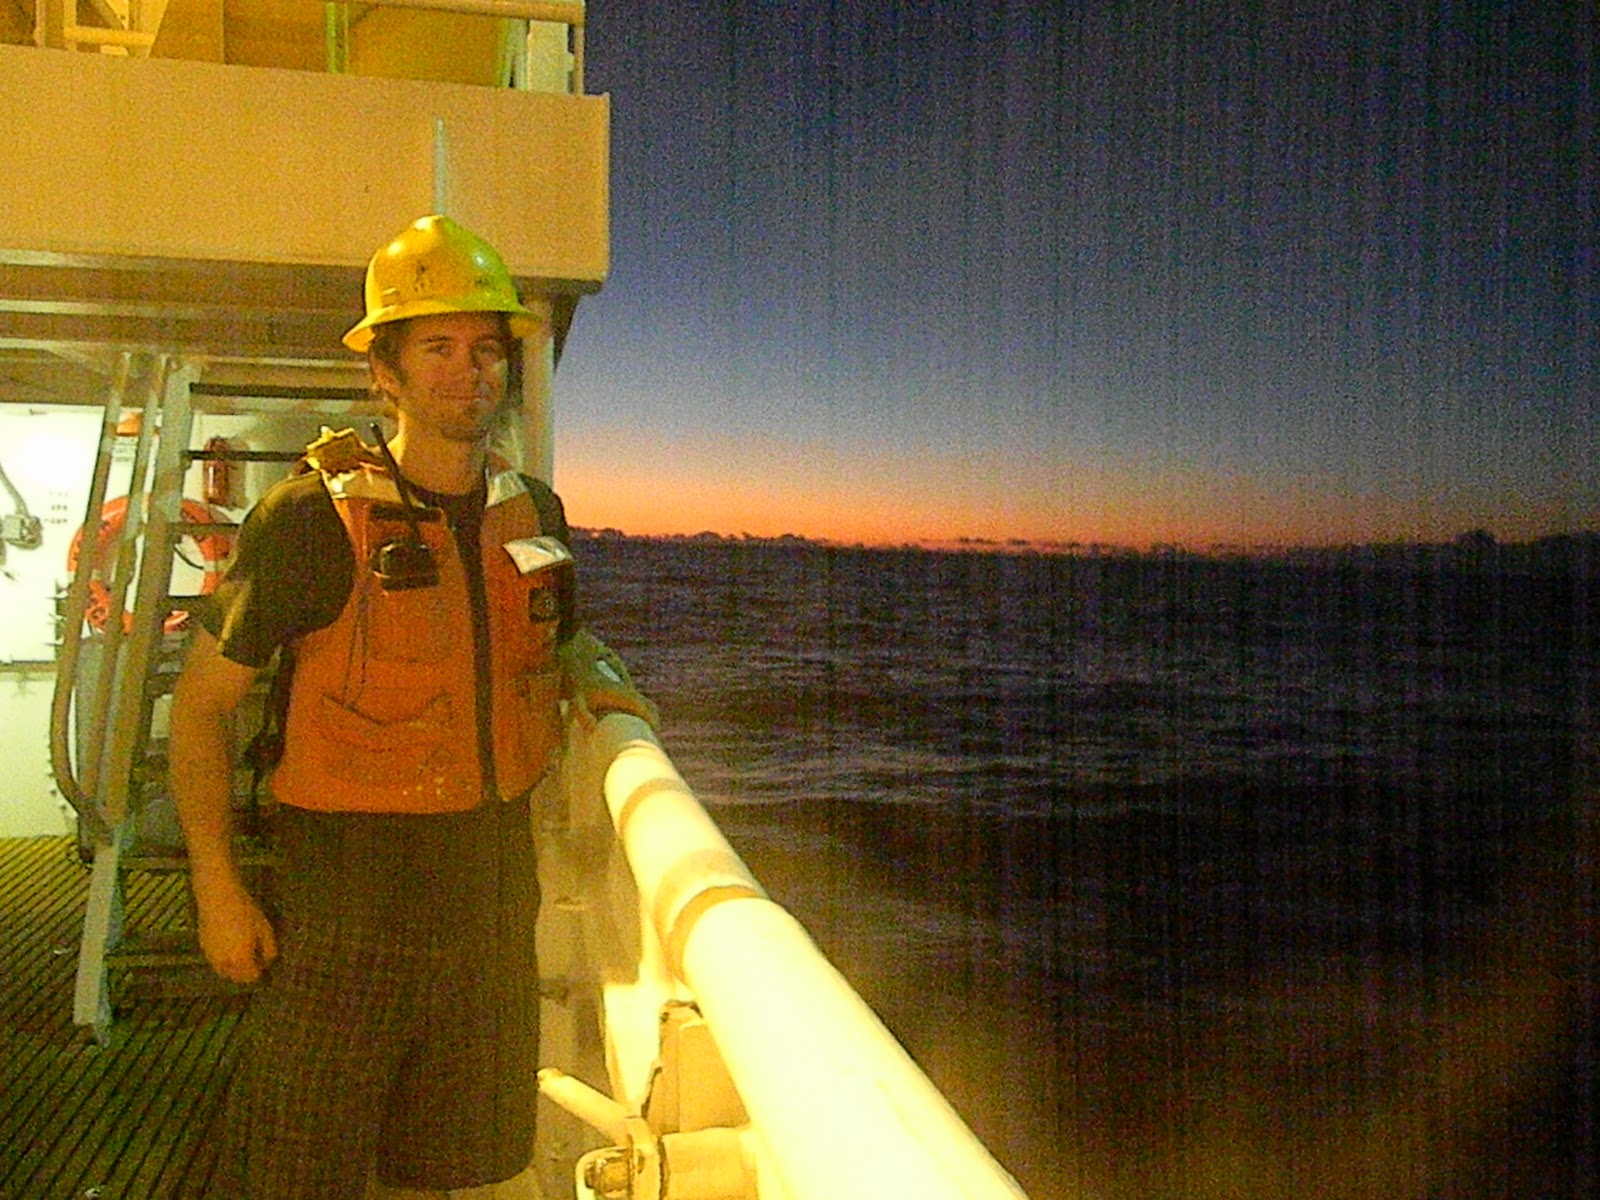
| Only two more days left of my "security" position. I enjoyed talking to Ray, and watching the squid that kept us company. Not a bad view to start off your day! |
Another back-up test is the bucket test, it will recheck the chlorophyll. The bucket test is as it says, a narrow bucket lowered over the side. It too is dropped into the moving water, but is brought to the surface with a water sample. Corey pours it into a sample bottle which she will test in the lab 24 hours later. Temperature is also recorded at the same time.
All of this testing and retesting is what is needed to provide reliable data that can be stored and evaluated at a later date. The data may seem inconsequential at the time, but it is truly the glue that holds the clues to why animals are in some areas and not in others.
Oceanography is a very exciting science because there is so much left to learn. The more information we have, the more clearly we can understand our global environment.
No comments:
Post a Comment